Important WGU Applied Algebra Exam Questions
WGU Applied Algebra FXO2 PFXP C957 Applied Algebra Exam
Attempt the WGU Courses and Certifications practice test and solve real exam-like Applied Algebra questions to prepare efficiently and increase your chances of success. Our WGU Applied Algebra practice questions match the actual WGU Applied Algebra FXO2 PFXP C957 exam format, helping you enhance confidence and improve performance. With our Applied Algebra practice exam software, you can analyze your performance, identify weak areas, and work on them effectively to boost your final WGU Courses and Certifications exam score.
| Vendor: | WGU |
|---|---|
| Exam Name: | WGU Applied Algebra FXO2 PFXP C957 |
| Registration Code: | Applied-Algebra |
| Related Certification: | WGU Courses and Certifications |
| Exam Audience: |
Question: 1
The number of people, , in a festival audience is represented by the graph, with the number of hours since the beginning of the festival along the horizontal axis and the size of the audience along the vertical axis.
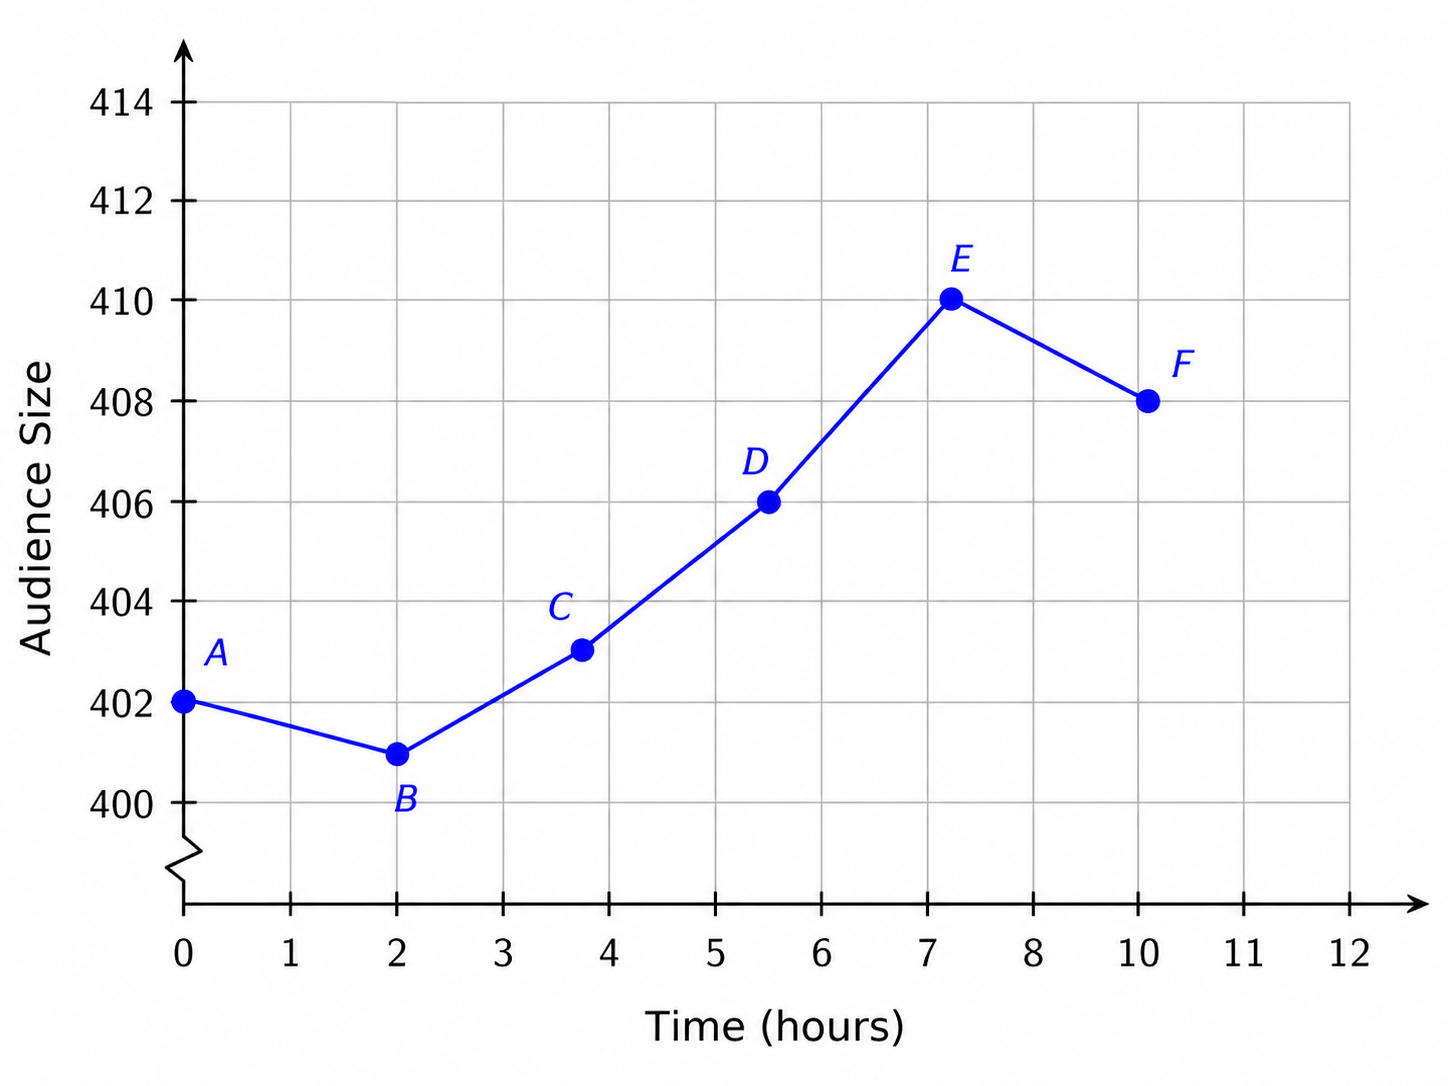
Point represents an audience size of 402 for the first hour of the festival, or .
Which ordered pair represents a point on the graph?
Question: 2
A person makes down quilts to sell.
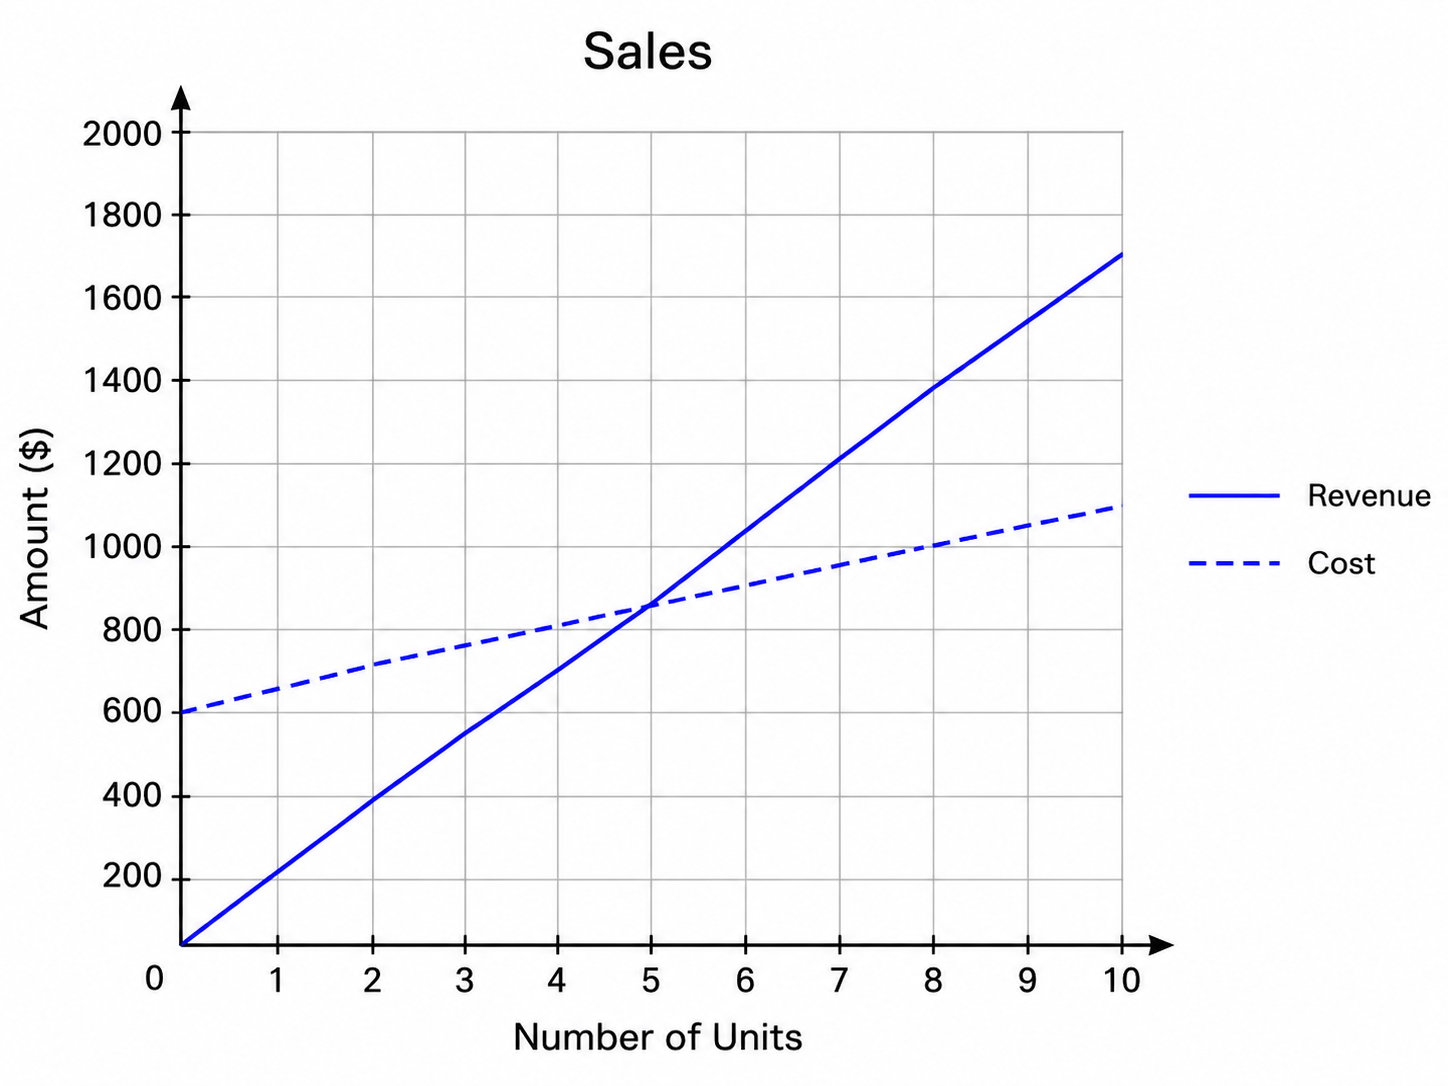
The graph shows the functions that model the cost and revenue.
How many down quilts need to sell to break even/start making a profit?
Question: 3
The number of tasks completed by computer B is 12 more than the number of tasks completed by computer A. Let represent the relationship between the number of tasks completed by the two computers, where is the number of tasks completed by computer A and is the number of tasks completed by computer B.
Which function represents this situation?
Question: 4
Based on collected data, the number of employees at a firm can be modeled using the function
whose graph is shown, where represents the number of years since 2001 and represents the number of employees, in thousands.
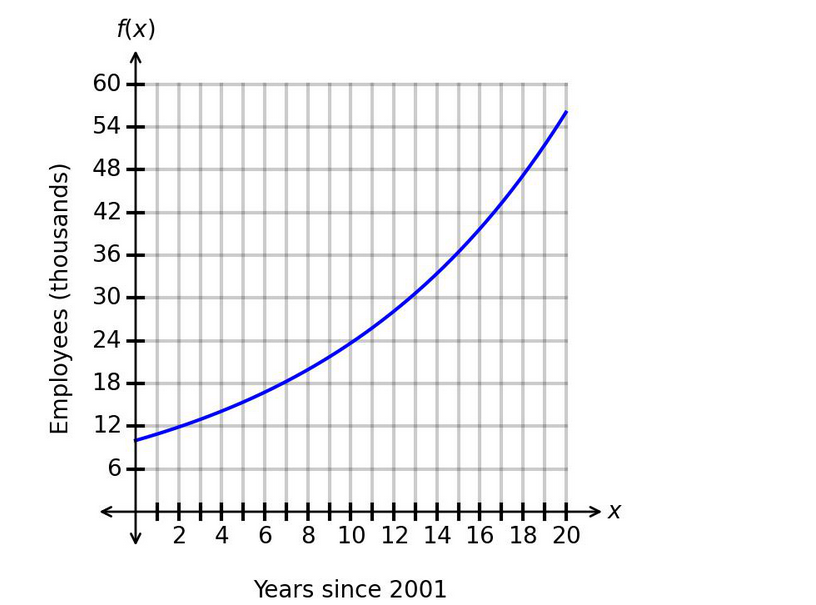
Which time period has the fastest average increase in the number of employees?
Question: 5
The graphed function represents the number of animals, , at a feeding station hours after 5:00 a.m. The plotted points and have coordinates and .
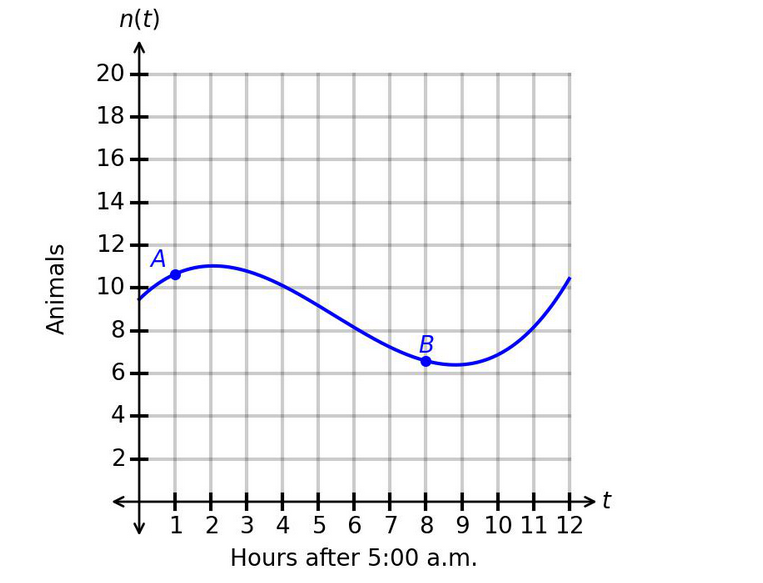
Which statement gives the correct interpretation of the average rate of change of the number of animals over the interval from point to point ?
Other WGU Certification Exams
Introduction to Cryptography Exam
WGU Introduction to Cryptography HNO1
Accounting for Decision Makers Exam
WGU Accounting for Decision Makers C213 VAC2
Foundations of Programming Python Exam
Foundations of Programming (Python) - E010 JIV1
Global Economics for Managers Exam
WGU Global Economics for Managers (C211, UZC2)
VPC2 Data-Driven Decision Making C207 Exam
VPC2 Data-Driven Decision Making C207
WGU Financial Management VBC1