Important SAS A00-240 Exam Questions
SAS Statistical Business Analysis SAS9: Regression and Model A00-240 Exam
Attempt the SAS Certified Statistical Business Analyst practice test and solve real exam-like A00-240 questions to prepare efficiently and increase your chances of success. Our SAS A00-240 practice questions match the actual SAS Statistical Business Analysis SAS9: Regression and Model exam format, helping you enhance confidence and improve performance. With our A00-240 practice exam software, you can analyze your performance, identify weak areas, and work on them effectively to boost your final SAS Certified Statistical Business Analyst exam score.
| Vendor: | SAS |
|---|---|
| Exam Name: | SAS Statistical Business Analysis SAS9: Regression and Model |
| Registration Code: | A00-240 |
| Related Certification: | SAS Certified Statistical Business Analyst Certification |
| Exam Audience: |
Total Questions
99
Last Updated
21-08-2026
Exam Duration
120 MINUTES
Upgrade to Premium
GET FULL PDFQuestion: 1
Within PROC GLM, the interaction between the two categorical predictors, Income and Gender, was shown to be significant. An item store was saved from the GLM analysis.
Which statement from PROC PLM would test the significance of Gender within each level of Income and adjust for multiple tests?
Question: 2
An analyst knows that the categorical predictor, storeId, is an important predictor of the target.
However, store_Id has too many levels to be a feasible predictor in the model. The analyst wants to combine stores and treat them as members of the same class level.
What are the two most effective ways to address the problem? (Choose two.)
Question: 3
Refer to the REG procedure output:

The Intercept estimate is interpreted as:
Question: 4
A linear model has the following characteristics:
* A dependent variable (y)
* One continuous variable (x1)
* One categorical (1 with 3 levels) predictor variable and an interaction term (1 by x1)
How many parameters, including the intercept, will be estimated for this model?
Enter your numeric answer in the space below.
See Below Explanation:
Question: 5
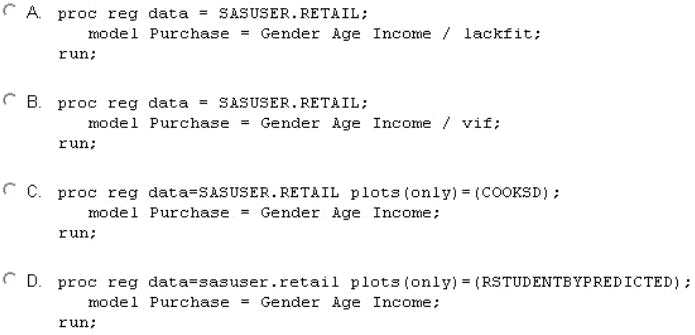
Which SAS program will detect collinearity in a multiple regression application?
Other SAS Certification Exams
SAS 9.4 Base Programming - Performance-Based Exam
SAS 9.4 Programming Fundamentals Exam
SAS Certified Platform Administrator for SAS